Databricks: Data Engineering on the Cloud
In this semester , we have tried to build a recommendation system based on a large stream of movies and user behaviors data in the course Machine Learning in Production(CMU 17645). Besides training accurate models based on the stream, we believe it is also important to get some statistics features (i.e. average length of movie, distributing of the scores) from the current data set we extract from the stream. The statistic features can help us monitor the data quality, as well as letting us observe the concept drift as soon as possible (i.e. The users become stricter raters → 3/5 is a great score now, although it’s terrible in the past).
As the data accumulates when being continuously collected from the stream, computing the statistic features becomes inefficient on a single node. Thus, we decide to utilize the distributed framework like Spark or Flink to engineer our data in scale. However, as a team mainly composed of students with only data science background, we find several difficulties even though some of us know how to work with Spark:
- Building and maintaining a Spark Cluster is painful and expensive
- The spark script is hard to debug and update, and the result cannot be visualized easily.
Why Databricks?
Databricks is a web-based platform for working with Spark, that provides automated cluster management and solution for data warehouse and collaborative working on notebook. Databricks is developed by the origin team which created Spark.
We find Databricks extremely helpful in our use case. With the platform provided by Databricks, we can launch a Spark cluster in minutes without knowledge in cloud computing and distributed systems, and we needn’t invest any time to maintain it. Moreover, Databricks provides a feature named notebook, whereby we can write and run spark code, monitor the cluster, and visualize the result interactively in a single web document.
To wrap up, we can enjoy the fast processing of large set of data with zero effort on maintaining a cluster on Databricks. Thus, we decide to analyze our data set on Databricks periodically to monitor the statistics of our data.
About Apache Spark
Apache Spark is a popular distributed framework that can process big data in scale, as well as utilizing the in-memory storage to optimize the speed of tasks. Even though data analytics on the Databricks depend heavily on Spark, we will not elaborately discuss Spark here (but a big picture is given below), since this post will focus on using the features of Databricks to facilitate the data engineering pipeline.
In brief, Spark cluster has a Driver node, which is responsible for coordinating and managing the working nodes. Each working node has several executor processes, trying to complete the task assigned by driver in parallel.

Here, we also give you a oversimplified “hello world” example of Spark to let you roughly know how spark works:
rdd = sc.textFile(“./sample.txt”)
rdd = rdd.map(lambda line: line.split()).flatMap(lambda word: (word, 1))
result = rdd.reduceByKey(lambda a, b: a + b).collect()
The first line of the the above code transform the text file into a data structure named RDD that Spark can handle (each line of the file becomes a row). The second line maps each line into a lists of word, and then transforms to the key-value pairs like (“word”, 1), (“count”, 1) . Note that each node in the cluster holds many pairs and this transformation is done in parallel.
The reduceByKey() will group all the pairs with same key together and sum the values. For example, if we have 5 pairs of (“word”, 1) and 3 pairs of (“key”, 1), we will finally get (“word”, 5) and (“key”, 3). Note that this process needs to collect the same key on the same nodes, and need expensive network IO and synchronization. Finally, the collect() will collect the result from work nodes back to master nodes.
We know this is an oversimplified example and many basic concepts of Spark are not covered here, but at least you know the basic idea behind Spark: let many work nodes compute in parallel (map), and only aggregate the result when necessary (reduceByKey). To get more practical demo of Spark, a nice blog about using Spark to analyze movie data can be found here. In our notebook and demo here, we will explain our code shown to make sure you understand what happens.
Setup
To use Databrciks, you first need a Databricks account, then all the setup you need to do is creating the cluster your project works on, and configuring the corresponding Spark runtime and the necessary libraries with user-friendly UI provided by Databricks. You can create your own free cluster in minutes by referring to this link. Particularly, we choose Spark 3.0.1 as our runtime. In the library tab of the cluster, you can add any popular python library to your cluster, if you use python to write your Spark code.
Moreover, we use the notebook to build our data engineering pipeline, since the notebook is one of the coolest features provided by Databricks. With notebook, we can write runnable code on a web document, whereby you can interactively get the result of your code, visualize the result, and embed other descriptive text. Creating a notebook in your Databricks is as simple as creating the cluster by this guide.
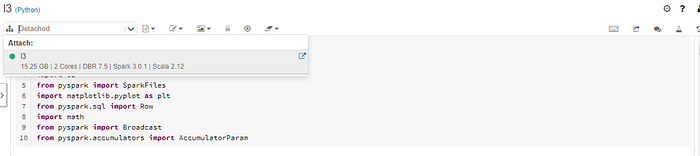
After creating the cluster and notebook, you need to attach the notebook to the cluster, since the code on your notebook needs a cluster to run (the cluster is the “environment” of your notebook). To attach the cluster, open your notebook and find the following drop-down list and select the active cluster with green circle:
Data Engineering on Databricks Notebook
We first prepare a data set at this repository. The format is shown below.

Generally speaking, the notebook has several sections of code, and each section of code can run interactively and separately. Also, the variables and functions defined in the previous section are also visible to the later ones.
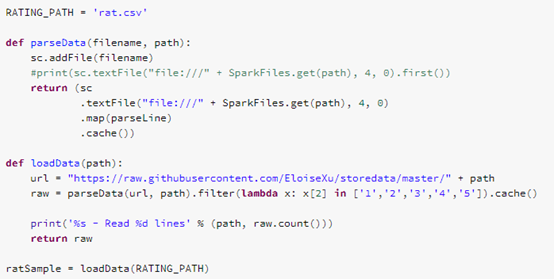
In the first section, we download and save the data set by the following codes. All of our codes are written by pyspark, the python library that supports Spark. Here, you only need to know that sc.addFile() is an interface to load external data set into the Databricks cluster . Actually, Databricks provides a much more powerful tools named data lake to process and stream heterogeneous semi-structured data, but we will not use this feature in our simple demo.
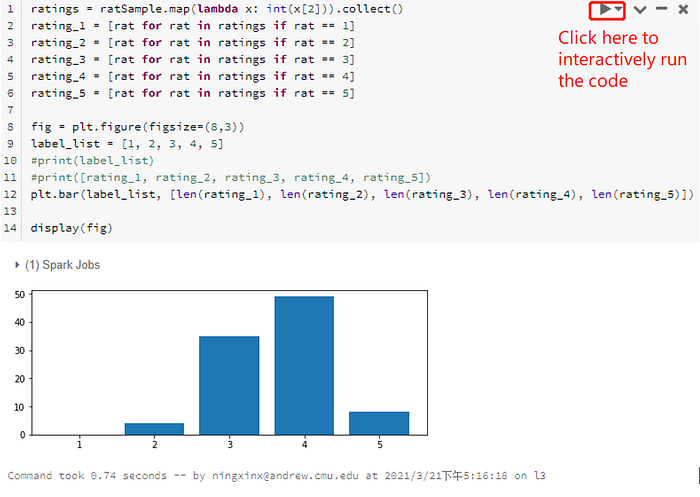
With these data, we give you a demo on how powerful the notebooks can be to visualize the result of the task interactively. Usually, we use matplotlib python library to create plots. Here, we use this method to explore how many movies have ratings 1, 2, 3, 4, and 5. We first use collect() to obtain a list containing the ratings in each record in the training data set. Then, we create a bar chart showing the number of different ratings. After writing these codes, we can click the “run” button on the right-top of this section to see the results:
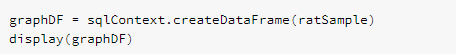
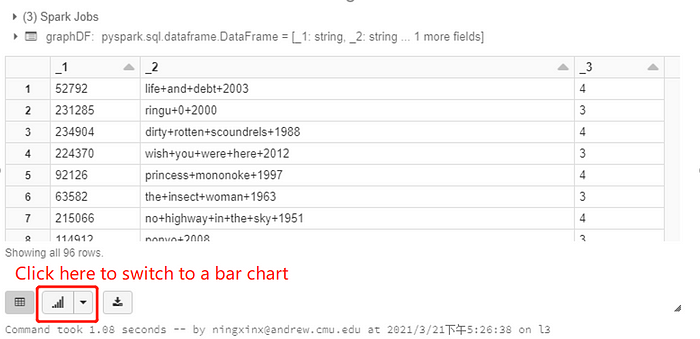
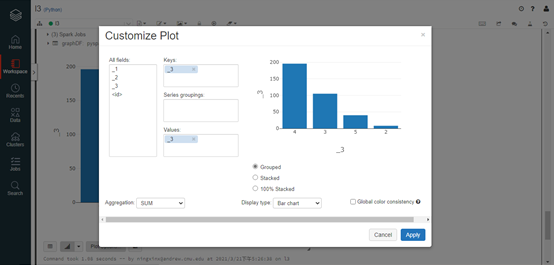
Actually, we don’t need to collect the result and manually plot the statistics with matplotlib. We could simply use the user interface provided by Databricks to decide how to create such plots without any external library. In this example, we create a dataframe from the spark RDD called graphDF, and use the display() provided by Databricks to visualize it. The display() will show the result in a big table by default, but we can switch it to a bar chart by clicking the button at the bottom:
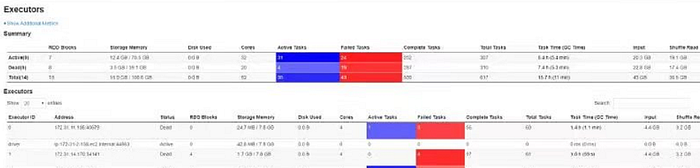
Above is all the code we want to show in this blog. Otherwise, the notebook also support collaborative edit through sharing and job monitoring of each section of code through spark UI (a visualization tools to how and how long each job/task runs & the state of the nodes). The complete version of our notebook can be seen here. Making it more unbelievable, there is also some practices to achieve CI/CD directly via notebook. If you are interested in this topic, you can refer to this blog.
Conclusion
Databricks is quite helpful for us to analyze and monitor the statistic features of our streaming data, since it has the following advantages:
- Easy to launch the Spark cluster with very little configuration required, and the no effort necessary for maintainance.
- The notebook is interactive and collaborative. Databricks also provides convenient interface to load and visualize data. It is also possible to directly deploy the notebook in production.
Even though Databricks can provide small team like us with efficiency, you should also consider the following limitations of Databricks:
- If you already have an infrastructure team, or your tasks of data mining are huge and frequent, using databricks might not be an economical choice.
- Databricks only supports Spark as the computing engine. If you want to migrate to another framework like Flink, you need to give up Databricks.
